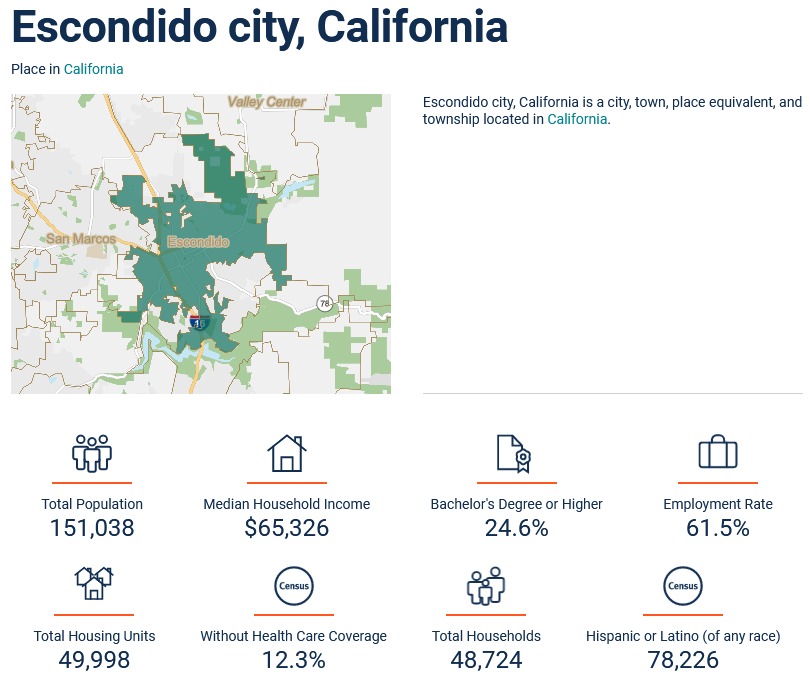
Incorporated: 10-8-1888
Elevation: 400 ft.–2,100 ft.***
Latitude: 33° North
Longitude: 117° West
Size:
| City Limits*** |
Sphere of Influence*** |
Industrially Zoned Properties*** |
| 23,872 acres |
43,589.85 acres |
1,134.29 acres |
| 37.30 sq. miles |
68.11 sq. miles |
|
| Population:* |
1980 |
1990 |
2000 |
2004 |
2008 |
2011 |
2012 (E) |
| Escondido |
64,355 |
108,635 |
133,559 |
140,671 |
143,389 |
143,911 |
146,057 |
| Growth from Prior Period |
75% over 1970 |
69% over 1980 |
23% over 1990 |
2.7% over 2003 |
0.7% over 2007 |
unchanged |
1.5% over 2011 |
| County |
1,861,864 |
2,498,016 |
2,813,833 |
3,017,204 |
3,146,274 |
3,095,313 |
3,143,429 |
| Ethnicity:** |
Hispanic |
White |
Black |
Native American |
Asian, Hawaiian/ Pacific Islander |
Mixed Race/Other |
| 2000 Census |
51,693 38.7% |
69,305 51.9% |
2,734 2.0% |
776 0.6% |
6,063 4.5% |
2,988 2.2% |
| 2004 SANDAG |
58,626 42% |
68,323 49% |
2,741 1.9% |
828 0.5% |
6,776 4.7% |
3,377 2.4% |
| 2011 SANDAG |
70,326 48.8% |
58,142 40.4% |
3,046 2.1% |
776 0.5% |
8,797 6.1% |
3,023 2.1% |
2012 (E)
|
72,809 |
57,985 |
2,749 |
578 |
8,747 |
3,189 |
| % of Total |
49.8% |
39.7% |
1.9% |
0.4% |
6.0% |
2.2% |
| Gender:** |
Female |
Male |
| 2000 Census |
67,330 |
66,229 |
| 2004 SANDAG |
70,857 |
69,814 |
2012 (E)
|
74,081 |
71,976 |
| Age:** |
<15 |
15-34 |
35-64 |
65> |
|
| 2004 SANDAG |
24% |
31% |
35% |
10% |
Median Age: 31.9 |
2012 (E)
|
22.7% |
30.1% |
36.2% |
11% |
Median Age: 33.0 |
All Housing Units:**
| 1990 |
1992 |
1994 |
1996 |
1998 |
2000 |
2002 |
2004 |
2008 |
2011 |
2012 (E) |
| 42,040 |
42,893 |
43,423 |
43,837 |
44,577 |
45,050 |
45,575 |
46,155 |
47,288 |
47,682 |
48,333 |
Housing Types:**
| Single-Family Housing |
Multifamily (Apts/Condos) |
Mobilehomes |
| 27,738 |
16,856 |
3,739 |
Persons per Household:**
| 1990 |
1992 |
1994 |
1996 |
1998 |
2000 |
2002 |
2004 |
2008 |
2011 |
2012 (E) |
| 2.73 |
2.76 |
2.795 |
2.853 |
2.924 |
3.01 |
3.054 |
3.09 |
3.08 |
3.12 |
3.12 |
Escondido Median Income per Household:**
| 1990(a) |
1996(a) |
1998(a) |
2000(a) |
2002(a) |
2004(a) |
2008(a) |
2011(a) |
2012 (E) |
| $33,260 |
$33,990 |
$38,969 |
$42,567 |
$43,328 |
$46,907 |
$44,402 |
$40,127 |
$56,261 (using 2010 $) $57,968 (current $)**** |
San Diego County Median Income per Household:**
| 1990(a) |
1996(a) |
1998(a) |
2000(a) |
2004(a) |
2008(a) |
2010(a) |
2012 (E)
|
| $35,022 |
$38,477 |
$42,357 |
$46,503 |
$52,192 |
$50,710 |
$44,772 |
$67,148 (using 2010 $) $69,185 (current $)**** |
Escondido's Median Income per Household:**
| |
<$15k |
$15k - $30k |
$30k - $45k |
$45k - $60k |
$60k - $75k |
$75k - $100k |
$100k+ |
| 2010: |
14% |
22% |
19% |
15% |
10% |
10% |
10% |
| 2012: |
10% |
15% |
15% |
14% |
11% |
13% |
22% |
Sources:
* State Department of Finance Estimates
** SANDAG Estimates – Entries marked (a) used 1999 $, 2012 estimates now using 2010 $.
*** GIS Manager, Information Systems (includes Daley Ranch area). Industrial figure does not include roadways in its total.
**** U.S. Bureau of Labor Statistics as reported by SANDAG.
Note: Entries labeled 2011 are from SANDAG’s October 2011 estimates update, which reflect 2010 U.S. Census data.
Updated 3-26-13